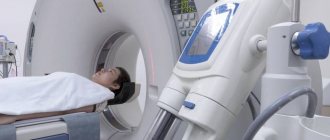
Brain Evoked Potential Study
Posted at 00:31h in Services by doctor
Evoked potential is an electrical signal with which nerve cells respond to an external stimulus or to perform a mental task.
In 1929, HansBerger from Germany drew attention to the bioelectrical activity of the brain: when an electrical impulse is transmitted from one neuron to another, weak electrical waves arise, and an electroencephalograph device can record them.
The electroencephalogram reflects the general bioelectrical activity of brain activity. It was impossible to isolate from it the reaction to external stimulation of any individual visual or auditory analyzer at that time, since the biofield of the evoked potential (from 0.5 to 15 μV) is tens and hundreds of times weaker than the general activity of the brain (20 - 50 μV).
Only in the middle of the twentieth century did a device appear that made it possible to isolate weak amplitudes of evoked potential oscillations from the total amplitude of brain activity. This occurs using the summation method: stimulation that stimulates the potential being studied is repeated from 100 to 1000 times at precise time intervals.
The computer summarizes only those segments of the encephalogram (EEG) that immediately follow the sensory stimulation. If the total amplitude during this time can increase and decrease, take on positive and negative values and in total tend to zero, then the evoked potential has the same response form and accumulates depending on the number of stimuli given.
The more stimulating external influences, the lower the “noise level” of the overall activity. An evoked potential with a high intrinsic amplitude is isolated quite cleanly with the help of 50–60 repetitions, and a weak response to a stimulus requires more than 500 repetitions for its isolation.
- stimulus generator - a device made from electrodes on the head;
- bioelectric impulse amplifier
- analog-to-digital converter;
- computer for data processing;
- printer for printing.
Properties of evoked potentials
Necessary concepts for deciphering and interpreting the results:
- Latency is the time from the beginning of stimulation to the maximum value of the response impulse. Short-latency EPs (less than 0.050 sec); medium-latency (0.050 – 0.1 sec.); long-latency (longer than 0.1 sec.).
- Oscillation amplitude is the range of oscillation from maximum to minimum value.
- Polarity . To the same irritation, symmetrical parts of the brain can respond in diametrically opposite ways.
- Aftercharge is the decay time of the response pulse. It occurs 0.3 seconds after the stimulus is given and lasts from 0.5 seconds to 1 second).
Sensory evoked potentials are divided into visual, brainstem auditory, somatosensory, and motor. Studies of each of them make it possible to diagnose a variety of diseases of the nervous system.
Reaction of the organs of vision
Visual evoked potentials are bioelectrical impulses from the brain in response to irritation of the visual organs. They examine vision all the way from the retina to the centers in the cerebral cortex located in the occipital part, and can determine the location and nature of its damage.
Visually evoked potentials (VEPs) use the visual analyzer to assess the functioning of the nervous system. They assume that the patient is able to focus his vision and keep his gaze at one point.
If the patient has an injury to the eye, optic nerve, or impaired thinking abilities, the VEP method is not recommended. In most cases, stimulation is given to one eye using LED glasses.
- Reaction to a flash of light . The study is carried out for patients who cannot fix their gaze or have difficulty seeing at all; The method is used for early diagnosis of visual impairment in newborns. Flashes are stimulated using a matrix in LED glasses; they are presented monocularly. The patient is in a room isolated from light and sound, his eyes are closed. Working electrodes are connected to the occipital region; reference electrodes are usually ear or frontal. To obtain a satisfactory picture of evoked potentials, it is sufficient to carry out from 50 to 100 stimulations. The response to an external stimulus will be a series of oscillations - positive and negative - with the same latency.
- Reaction to a change in chess pattern . The subjects observe a frequent change of cells - black and white. Large cells stimulate peripheral vision, small cells mobilize central vision. To isolate evoked potentials, it is necessary to make 100–200 external stimuli.
Interpretation of results
The following values are taken for analysis: N75; P10; N145. The index N means the lowest level (peak) of the pulse; P is the highest. Numbers 75, 100,
145 means the latency (duration) of each peak.
- increased latency (due to impaired speed of impulses passing through the optic nerves;
- violation of symmetry, when readings from the right and left eyes differ (due to damage to the cerebral cortex);
- change in amplitude, both upward and downward. The P100 indicator is especially important for correct diagnosis.
Results and its discussion
The most common reason for difficulty in clinical diagnosis of vision pathology in children, according to our observations, is early age and cognitive impairment. The use of visual evoked potentials in such cases allows us to objectify the assessment of visual function, regardless of the age, contact and condition of the patient.
The main parameters of visual EPs in response to a chess pattern and a flash of light in children with different forms of central nervous system damage are presented in Table. 1 and 2 respectively. The groups of children examined were homogeneous, representative by age and gender. In the group of children with pathology of the visual analyzer, three were identified with amaurosis, in whom VEP were not recorded, therefore the tables present examination data of children with only partial loss of vision.
As can be seen from the data presented in table. 1 and 2, statistically significant differences in VEP parameters from the norm occur primarily in children with pathology of the visual analyzer, multiple sclerosis, as well as with epilepsy, cerebral palsy and consequences of TBI.
Perinatal pathology of the central nervous system. Changes in the parameters of visual EP in children with congenital damage to the organ of vision are very diverse and correlate with the degree of damage to the analyzer. In case of pathologies of the peripheral part of the visual analyzer, it is possible to study the VEP with a flash of light to assess the degree of damage to the optic nerve. Severe disturbances of visual function, such as lack of gaze fixation, objective vision, amaurosis, are accompanied by a complete absence of VEP to the chess pattern and significant distortion of VEP up to complete absence, which objectively confirms a gross violation of the conduction of afferentation along the structures of the optic tract. Partial atrophy of the optic nerves is accompanied by a pronounced distortion of VEP, up to complete absence, and a significant decrease in amplitude in combination with an increase in VEP latency. It should be remembered that an objective assessment of the functional state of the central parts of the sensory systems using the EP method is not available in the presence of pathology of the peripheral parts.
In children with cerebral palsy, in 84.1% of cases, we identified violations of the parameters VVPp and VVPv. The most characteristic changes are the following: disruption of the response form (its defiguration), often accompanied by a decrease in peak amplitudes; decrease in EP amplitude while maintaining its shape; an increase in the latent periods of several or all VEP components; abnormal increase in peak amplitude; pronounced interhemispheric amplitude asymmetry of peaks; absence of VEPp with relative preservation of VEPv, correlating with impairments of objective vision, with preservation of light perception, inability to fixate gaze; absence of VEPp and VEPv in amaurosis. The described changes weakly correlated with the form of the disease, without revealing clear specificity, however, the degree and structure of these changes reflected the degree of brain damage in cerebral palsy and correlated with impaired visual function.
The results of our studies allowed us to recommend that patients with cerebral palsy periodically study visual EPs to assess the individual characteristics of the development of the visual analyzer. Children with delayed ontogenetic dynamics of VEP formation should be considered a risk group for the development of vision pathology and registered with an ophthalmologist with regular monitoring of visual functions. When identifying VEP disorders in children with cerebral palsy and concomitant vision pathology, we recommend including methods for activating the flow of visual afferentation in the rehabilitation plan [4, 5].
In patients with epilepsy, a characteristic change (83.3%) of VEP is a significant local or generalized increase in VEP amplitudes by an average of 3.3 ± 0.5 times, which determines the presence of amplitude interhemispheric asymmetries. Changes in VEP latency are less pronounced and are mainly due to an increase in amplitude. The response form takes the form of a spike.
With minimal brain dysfunction, speech underdevelopment, cognitive impairment, autism, and in the absence of concomitant pathology of the organ of vision, no significant changes in visual EP are observed.
Genetically determined pathology of the central nervous system. In Down syndrome, visual impairment is relatively common, but clinical diagnosis can be difficult due to cognitive impairment. In addition, impaired functioning of sensory organs sometimes resembles the picture of cognitive impairment. The study of visual EP contributes to the timely detection of lesions of the organ of vision in this population. Changes in visual EP in patients with Down syndrome are determined by the degree of damage to the peripheral part of the visual analyzer, as well as the state of the activating system of the brain. Accordingly, there is an increase in latencies, a decrease in VEP amplitudes of specific and nonspecific areas, and a distortion of the response form.
Demyelinating pathology. In patients with multiple sclerosis, changes in visual EP are not always pronounced, so their absence does not exclude the diagnosis of multiple sclerosis. However, when the structures of the visual system are involved in the pathological process, even in the absence of clinical signs of visual dysfunction, the VEP parameters change in a characteristic way: the latency of the main peaks increases (> 3 sigma), which is due to demyelination of the optic tract; in the presence of foci of demyelination in the visual cortex, the amplitude decreases and the shape of the VP is distorted. The described changes are characteristic, but, again, nosologically nonspecific and can only be considered in the context of clinical data. Over time, under the influence of specific treatment, VEP disorders are smoothed out, in some cases even leveled out, which usually correlates with remission of the disease.
Consequences of traumatic brain injuries. Changes in VEP in traumatic brain injuries are caused by a number of factors: damage to the peripheral part of the analyzer, the degree and nature of damage to the central part - the presence of foci of destruction, hematomas, hydrocephalus, dyscirculatory disorders, etc., as well as the state of the activating system of the brain. At the same time, in the focus of destruction there is a pronounced decrease in the amplitude of the response, distortion of its shape, up to complete absence. Hydrocephalus and circulatory disorders are characterized by instability of VEP release and distortion of the response form. It is possible to identify hidden foci of epilepsy. Disturbances in the state of the brain's activating system are reflected in disturbances in nonspecific VEPs. In turn, the preservation of the VEP in traumatic brain injury is a favorable diagnostic sign.
The phenomenon of interhemispheric asymmetry of visual EP. Interhemispheric VEP asymmetry is most pronounced in patients with atrophic changes in the visual cortex, as well as in cases of local hyperactivation of neurons. In healthy subjects and patients without symptoms of atrophy or hyperactivation of the VEP cortex, they are symmetrical. A slight asymmetry of amplitude or latency may occur in case of reversible disorders of cerebral circulation in the vertebrobasilar region, but it is unstable and is leveled out under the influence of treatment.
In patients with multiple sclerosis, interhemispheric VEP asymmetry due to a decrease in amplitude on the affected side is detected in cases where the atrophic focus is located in the visual cortex. When the visual cortex is intact, there is no asymmetry.
Interhemispheric VEP asymmetry in patients with epilepsy is of an amplitude nature due to local hyperactivation of cortical neurons in the focus of epilepsy. Moreover, in contrast to asymmetry caused by atrophic changes in the cortex, in epilepsy asymmetry is formed against the background of a bilateral increase in VEP amplitude compared to the norm.
In two groups of patients examined—children with cerebral palsy and consequences of TBI—we identified certain changes in VEP that cannot be regarded as pathological. Thus, changes in VEP in unilateral (or local) brain lesions had different directions - a decrease or increase in the amplitude of VEP on the side contralateral to the lesion. Those. There was interhemispheric VEP asymmetry at homotopic points.
The data we obtained are consistent with the data of L.R. Zenkova and M.A. Ronkin, who noted an increase in the amplitude of early EP components to light stimulation in the affected hemisphere [6]. According to these authors, such enhancement was maximum in areas homotopic to the localization of the site of destruction. According to the famous pathophysiologist Academician G.N. Kryzhanovsky, as well as L.S. Tsvetkova and other leading scientists, the emergence of hyperactive foci in the cortex during different periods of the recovery process, caused by the mechanisms of interhemispheric relationships, can be considered as compensatory reactions of the brain aimed at enhancing the activity of the impaired cortical analyzer and creating additional opportunities for improving the analytical and synthetic activity of the brain [ 7–12].
We have shown that with unilateral lesions (or diffuse ones, with a predominant involvement of one hemisphere), there is an increase in VEP amplitudes both in the homotopic zone of the opposite hemisphere and in the zones of nonspecific projection of the affected hemisphere. In the context of the literature data, it can be assumed that this nature of VP reorganization reflects the inclusion in the compensatory process of not only homotopic zones of the opposite hemisphere, but also nonspecific areas, mainly the thalamoparietal associative system [7–12]. Obviously, these multimodal associative structures, similar in functional significance to the affected ones, are gradually included in the work of the affected analyzer and thereby begin to compensate for its activity. The most likely areas of the parietal cortex that take part in the compensatory process are its peripheral zones, identified by electrophysiological methods as early components of associative responses and topically closest to the cortical part of the analyzer [7–12]. A possible mechanism for their involvement in the “work” of one or another functional system is through expansion directly along the cortex to nearby neurons and compensatory “disinhibition” of these cortical sections.
Thus, the phenomenon of interhemispheric VEP asymmetry is not only one of the main neurophysiological signs of brain damage, but also a reflection of compensatory processes. At the same time, it is most often possible to reliably differentiate the organic/functional nature of disorders only in the context of clinical and other instrumental studies (MRI, etc.).
According to our data, changes in visual EP in patients with various forms of central nervous system damage in the absence of nosological specificity have a number of clinically significant deviations:
1) absence of VEP or its individual components;
2) the presence of interhemispheric asymmetry in VEP amplitude or latency;
3) increase in VEP latency relative to the norm (> 2.5 sigma);
4) decrease in amplitude relative to the norm (> 2.5 sigma);
5) increase in amplitude relative to the norm (> 2.5 sigma);
6) violation of the form of the answer;
7) instability of VEP release.
The results we obtained are largely consistent with the data of the neurophysiological laboratory of Prof. V.V. Gnezditsky (Research Institute of Neurology, Moscow) and a number of foreign laboratories.
Brainstem evoked potentials to acoustic stimulation
Auditory evoked potentials are the response of the auditory nerve and parts of the brain (its stem part) to auditory stimuli.
The most common in medical practice are short-latency acoustic stimulation evoked potentials (ASEPs).
The sound signal along its path passes through 5 “stations” - departments of the central nervous system. Each of these centers responds to stimulation with an amplitude of bioelectric field oscillations with positive (P) and negative (N) peaks.
Amplitude bursts are produced by nerve centers in the following order: I. auditory nerve → II. cochlear nucleus →III. olive →IV. lateral lemniscus → V. inferior colliculus and cerebral cortex.
The signal transmission path of the auditory analyzer passes through the brain stem, which is associated with the vital functions of the body and its cognitive capabilities. Therefore, KASVP is used in assessing the condition of seriously ill patients in a coma, as well as in assessing a person’s intellectual activity.
The CASVP technique consists of using stimulation with short clicks, first on one ear, then on the other. Sound duration is 0.1 milliseconds, frequency is 10 clicks per second.
To record the evoked potential, the active electrode is placed on the crown, the control electrode is placed on the earlobe that receives the stimulus, and the ground electrode is placed on the opposite ear.
To accurately deduce CASVP from the general EEG background, the number of stimulating signals should be about 3000 with double averaging. The result is a graph of a wave function with five positive and negative peaks.
Interpretation of results
The absence of waves or the presence of only one amplitude instead of five indicates depression of vital centers and gives a poor prognosis for future life.
- the interval between I, II and III peaks is increased;
- amplitude III became smaller;
- waves of II, IV, V centers have changed.
Recent studies have established that component III of the evoked potential graph of the auditory analyzer - P300 (P is the designation of the positive peak, 300 is the latent period) is associated with cognitive evoked potentials.
A decrease in the amplitude of P300 and an extension of its latent period may indicate diseases of the intellectual sphere: schizophrenia, dementia, autism, parkinsonism, Alzheimer's disease.
Analysis of auditory evoked potentials is indispensable when searching for the causes of speech and hearing disorders in children, because make it possible to determine at what stage of sound signal transmission the failure occurs: either it is a peripheral disorder or a lesion of the central nervous system.
Principle of the method
The generation of different EEG rhythms is carried out due to different neural mechanisms. It is believed that these rhythms, recorded in a state of quiet wakefulness with eyes open and closed, reflect background or spontaneous brain activity. However, with the appearance of a stimulus or when a movement is performed, suppression (desynchronization) of activity in the alpha and beta frequency ranges of the EEG is observed during the first 200 ms. The dynamic characteristics of these rhythms indicate that they themselves do not reflect information processing processes, but rather the modulation of information flows in the brain. The characteristics of evoked potentials are latency (latency), amplitude (or area), polarity (negative/positive), and shape. There are two different functions of brain information flows:
- a function associated with information flows associated with the processing of sensory information or actions;
- a function of modulation of information flows, which manifests itself in the form of synchronization or desynchronization of EEG activity.
Evoked potentials are recorded in the central nervous system after stimulation of the sensory organs. 4 There are three types of evoked potentials that are widely used in clinical practice: auditory evoked potentials, usually recorded from the scalp but arising at the level of the brainstem; visual evoked potentials and somatosensory evoked potentials, which are evoked by electrical stimulation of peripheral nerves. Examples of using:
- SSEP can be used to localize lesions of the peripheral nerves or spinal cord.
- Visual evoked potential (VEP) and auditory brainstem EP (BAEP) can complement neuroimaging as part of diagnostic studies for diseases such as multiple sclerosis.
- Short latency ERPs such as somatosensory evoked potential, visual evoked potential, and auditory brainstem evoked potential can be used to determine the prognosis of traumatic and anoxic traumatic brain injury. In the early stages after anoxic traumatic brain injury, the absence of a response in at least one hemisphere for several days highly predicts an unfavorable outcome. In traumatic brain injury, abnormal responses indicate an inability to recover from coma. In both types of injury, normal responses are highly likely to predict a favorable outcome. Moreover, restoration of responses to EP often indicates clinical recovery.